Today, Cerner announced the release of the publicly available Reopening and Social Distancing Projections dashboard tool that helps organizations plan for reopening of elective care services and potential re-surges. Organizations can use the tool to view the trend of COVID-19 cases within their community, state, and country in the last 14 days and evaluate the potential consequences of reducing social distancing.
Understanding the Cerner Reopening Risk Index
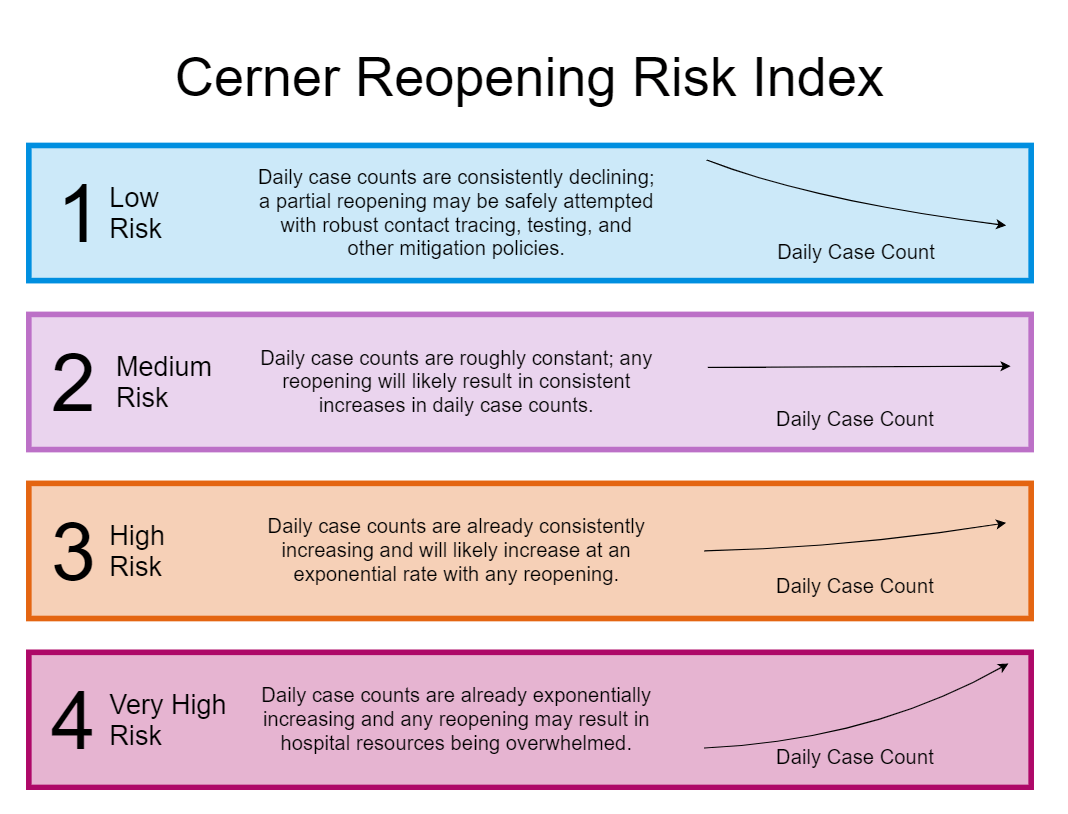
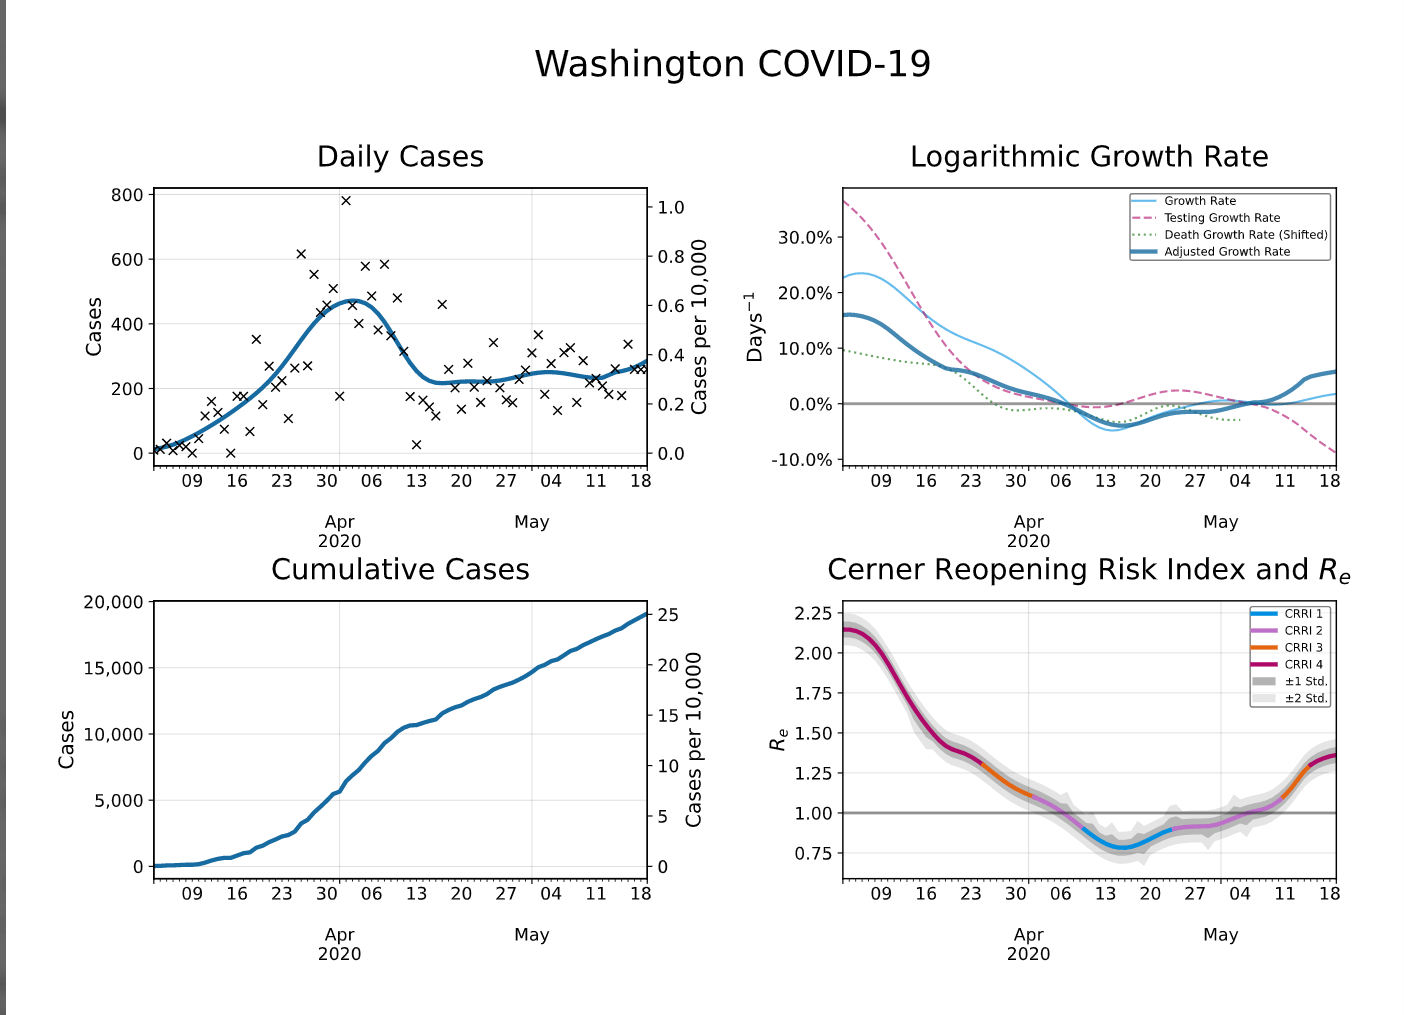
Cerner has compiled a Reopening Risk Index (CRRI) with four risk categories. The index is based on the trend of COVID-19 cases within the last 14 days and provides guidance to stakeholders evaluating the potential consequences of reducing social distancing.
As health systems consider rescheduling procedures and states ease social distancing, organizations can leverage this dashboard tool to see how the rate of COVID-19 cases is trending in their area and forecast the impact of relaxing or tightening restrictions.
Background/Methodology
For the purposes of these scenarios, the reopening date is currently set to planned reopening dates at the State level if known. In the U.S., based on recommendations from the White House, beginning a partial reopening should only be undertaken when the number of documented cases has a downward trajectory over a 14-day period.
Cerner utilized publicly available data sources from Definitive Healthcare hospital bed data, Johns Hopkins CSSE COVID-19 case count data, U.S. Census county population counts, Dataset from the American Red Cross: COVID19 Public Health Emergency Status by County, The COVID Tracking Project, and Our World in Data to build this tool.
COVID-19 U.S. County-Level Utilization Forecasting Tool

In addition to the COVID-19 Reopening and Social Distancing Projections Dashboard, Cerner has developed the U.S. County-Level Utilization Forecasting tool to help communities prepare for any new surges of COVID-19 testing and treatment demands by predicting needs and identifying potential shortages before they happen. The model runs a modified version of Penn Medicine’s CHIME (COVID-19 Hospital Impact Model for Epidemics) Model and uses publicly available and accepted data sources to help predict peak surge dates and determine how many beds and ventilators each U.S. county will need compared with how many they have. While other statewide projections can skew more toward large urban areas, this tool analyzes data on an individual county level to help communities prepare.
Public Data Sources are updated at 7 p.m. CT daily (reporting for the day prior). The Cerner model is then updated the following morning at 8 a.m. CT.