Infographic created by healthcare app developers at Innoppl, an open source, web devevelopment and mobile shop illustrates how Apple's iOS9 new features is transforming digital health for consumers.
Read More
Healthcare Infographics | Healthcare IT News - HIT Consultant
State of Mobile Health Apps Security: Perception vs. Reality

55 percent of consumers expect their mobile health apps to be hacked within the next six months, according to a recent report from Arxan Technologies. Executive IT leaders (48%) who have oversight or insight into the security of the mobile healthcare and produce apps also share the same concerns.
For the report, "State Application Security," Arxan Technologies surveyed 318 consumers and 80 IT executives with security oversight or insight into mobile health apps in the US, UK, Germany, and
Read More
Infographic: Average Health IT Salary is $111,388

The average health IT salary for HIT professionals is $111,388, according to recent results from the 2015 HIMSS Compensation survey. The survey hopes to serve as a tool for health IT professionals to compare salaries and compensation packages, while also offering an overview of the overall market including:
· Average salary and bonuses
· Salary by geographical region
· Top benefits (medical, dental, etc.)
The infographic shown below was released along with the survey finding to
Read More
Infographic: Top 10 Healthcare Cyber Attacks in 2015

Hackers accessed over 100 million health records in 2015 and eight of the 10 largest healthcare cyber attacks ever seen happened in 2015. The following Infographic created by CynergisTek, a KLAS-rated privacy and security assistance firm for provider organizations illustrates some of these healthcare privacy & security trends and challenge in 2015.
Read More
10 ICD-10 Codes Doctors May Need this Thanksgiving

The updated ICD-10 coding system has brought clinicians very interesting (and, admittedly, slightly humorous) diagnostics entries. As the weather cools, the last leaves fall off the trees and tables get packed with food and family for Thanksgiving, it’s a good time to take a look at some of those codes that will have doctors and patients prepared (for anything) this year.
The following infographic created by PatientKeeper compiles 10 Thanksgiving-themed ICD-10 codes that physicians’ should
Read More
Importance of Secure Messaging in Patient Communication (Infographic)

Secure text messaging solutions, when designed to address the needs of the healthcare organization, its providers and staff, can be an excellent communication mechanism to streamline conversations around patient care. The expected result is shortened response times, less emails and phone tag, improved workflows and overall improved patient care.
For patients, secure text mesaging can help improve patient engagement as well as strengthen the doctor-patient relationship. The infographic
Read More
Infographic: History of Security Data Breaches in Healthcare
Data breaches over the next five years will cost U.S. health systems $305 billion in cumulative lifetime revenue, according to a new report from Accenture. Key drivers behind the increase can be attributed to the significant increase in EHR adoption and other healthcare technology solutions creating a wealth of electronic information that includes patient data such as dates of birth, home addresses, social security records, insurance details and medical data. As a result of this new-found
Read More
Infographic: Decoding Big Data in Healthcare

We all want personalized healthcare options, however, in order to achieve this, we must let big data in to decipher and breakdown our individual wants and needs. Besides being an industry buzzword, what successes can big data translate into for healthcare workers and consumers?
The following infograpic created by Evariant, a company that helps leading hospital networks make sense of big data illustrates the following trends and benefits when big data is properly managed
· Improved profits
Read More
In-Person Visit vs. Telehealth Visit? Time Is Money
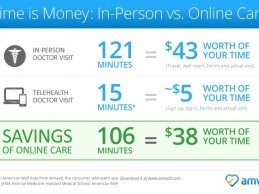
A recent study released by Harvard Medical School (HMS) published in The Journal of the American Medical Association (JAMA) found that the average total visit time for typical in-person medical visits was 121 minutes. This total time spent includes 37 minutes in travel time and 84 minutes in the clinic waiting and filing in paperwork.
Of the 84 minutes, only 20 minutes were spent face-to-face with a doctor. HMS estimates that the average opportunity cost per visit was $43 (not including cost
Read More
The Evolution of E-Prescribing: 10 Years of Interoperability

While the successful achievement of industry interoperability has been given a 10 year window by the ONC, we luckily don’t have to wait that long -- or at all -- to see health IT interoperability in action. Electronic prescribing is the perfect example of successful interoperability happening right now, and in honor of National Health IT Week, e-prescribing platform Surescripts has created an infographic illustrating the evolution of electronic prescribing.
Here are a few milestones of
Read More