What You Should Know:
– Data on COVID-19’s ever-changing behavior and its potential impact at the county level is now available with the release of the national Covid-19 Community Protection Dashboard.
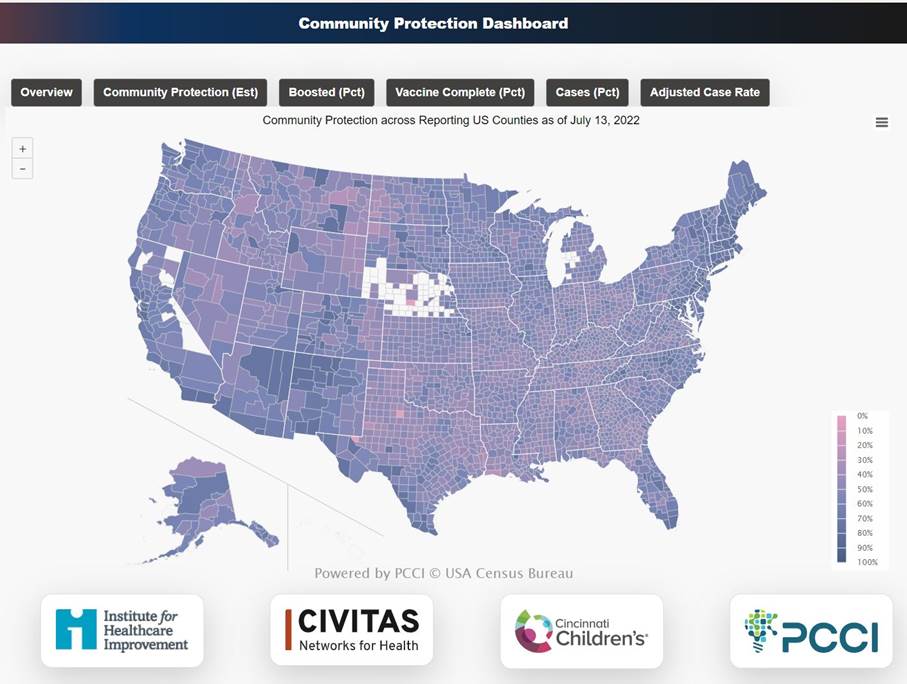
– The dashboard, available at: https://www.civitasforhealth.org/community-protection-dashboard/; offers an aggregate Community Protection Index (CPI) for nearly all of the counties in the U.S. in the form of a score that combines multiple factors. These factors include the percent of the population that has received a booster dose; the percent of the population that have completed an initial vaccine series; the percent of cumulative reported cases and the percent of presumed cases.
COVID-19 Community Protection Dashboard Background
Developed in a partnership between the Institute for Healthcare Improvement (IHI), Civitas Networks for Health (Civitas), Cincinnati Children’s Hospital (Cincinnati Children’s) and the Parkland Center for Clinical Innovation (PCCI), the Covid-19 Community Protection Dashboard is built from antibody prevalence surveillance, case reports, and counts of people with vaccinations series and boosters within a community.
The county-level CPI and core factors are available using a mouse-over interface on the dashboard’s map. The CPI is the score each county is given showing its population’s level of COVID-19 protection. A perfectly protected community would have a theoretical max score of 100. Currently observed national rates show an average CPI of 51.6. Nationally, the CPI range is between 41 to 83, showing a tremendous variation on the county level. For example, Los Angeles County, Calif., has a CPI of 70 based on its population being boosted, with 73 percent having completed its initial vaccine series as well as 30 percent reported infections and 63 presumed to be infected. Compare this to Fulton County, Ga., which reports a CPI of 59, due to a lower boost percentage, 47, completed vaccination series, 47 and 20 percent reported cases and 73 percent presumed infections.
The collaboration of these healthcare and data analytics organizations has developed the dashboard with the goal of bringing together multiple sources of readily available COVID data and interpreting the information in a consistent and digestible way, including:
– Taking into account the strong immunity from recent vaccination, but factoring the impact of waning immunity over time and the characteristics of the most recent variant
– Weighting the extra protection from booster vaccination against new variants
– Acknowledging the contribution from nature immunity
– Including estimates of hybrid immunity
This effort has been part of a larger initiative led by IHI with its lead partner, Civitas. In Phase 1 of the initiative, the IHI-led team implemented a rapid innovation cycle to learn from early experiences, scan emerging best practices and challenges, and develop a model for mounting a rapid local response to the U.S. vaccine crisis. Initial research conducted by IHI, The Health Collaborative, PCCI/Parkland Health and Cincinnati Children’s produced a vaccine implementation and delivery model as well as a set of change theory ideas for testing and scaling vaccine distribution in defined local populations.
In Phase 2, the initiative engaged in qualitative interviews with health departments and Health Information Exchanges (HIEs), which included Nebraska, North Carolina, Maryland, Texas and Indiana, to better understand how data has been used to support public health efforts during the Covid-19 pandemic. Through the work done in Phases 1 and 2, the Covid-19 Community Protection Dashboard prototype has been developed to support data sharing. A number of other deliverables and publications are in process and will be shared at various Civitas events, at the IHI Annual Conference and in upcoming journal articles and various publications.