What You Should Know:
– U.S. hospitals, health systems, and physician practices continue to face historically high operating expenses that increased patient volumes and revenues could not counteract, leading to negative margins for the sixth straight month in 2022, according to data from Kaufman Hall’s National Hospital Flash Report and Physician Flash Report.
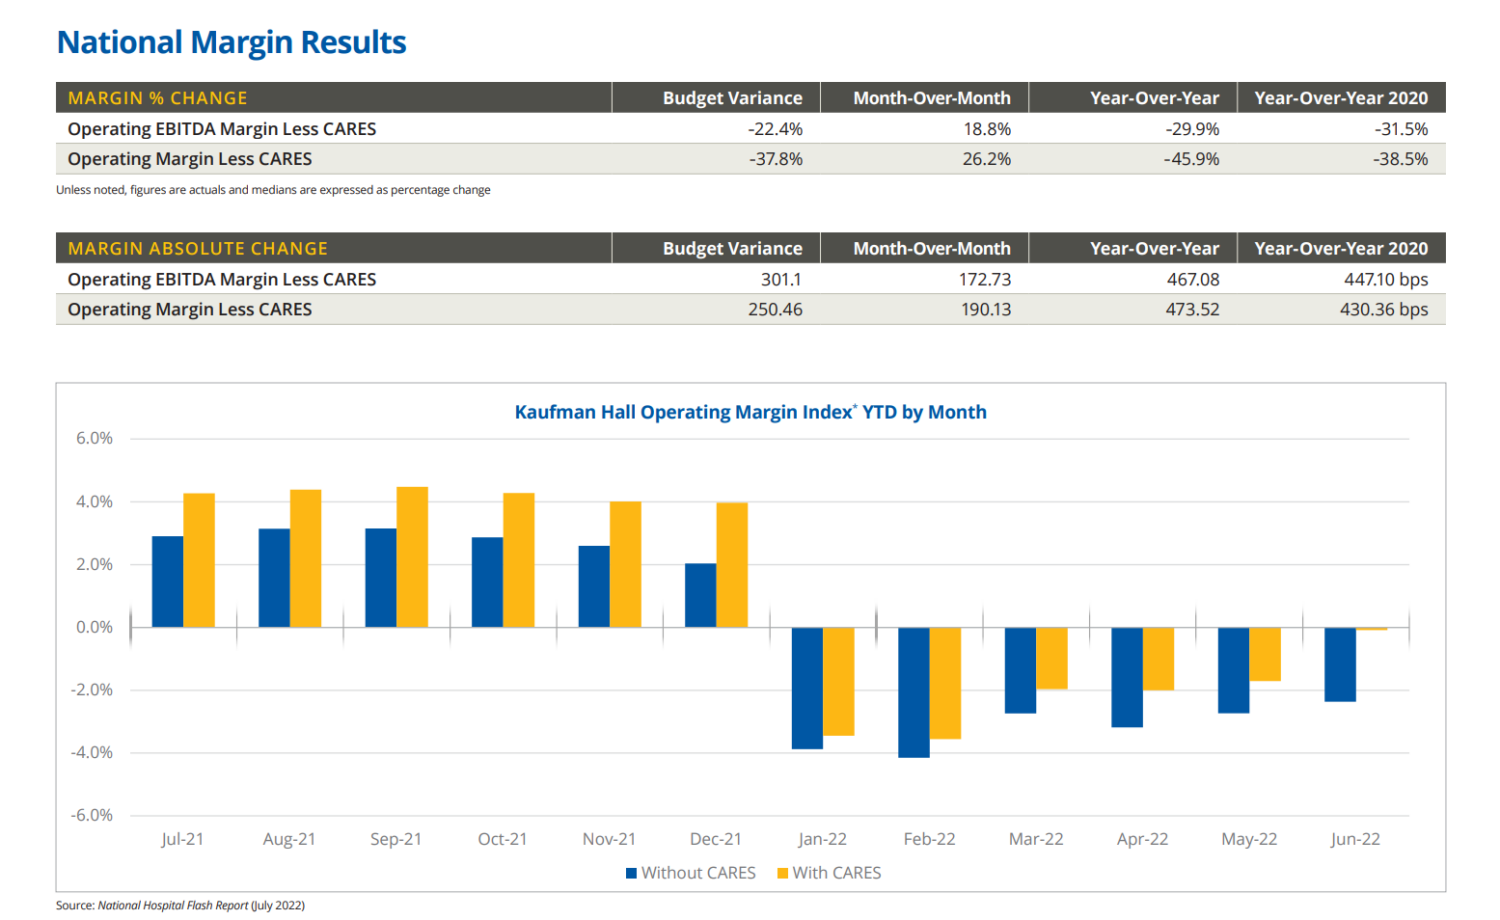
– The median Kaufman Hall year-to-date operating margin index for hospitals was -0.09% through June, for a sixth straight month of cumulative negative actual operating margins. However, the median change in operating margin in June was up 30.8% compared to May, but down 49.3% from June 2021. For physician practices, the median investment/subsidy per full-time provider continues to be materially higher than a year ago but showed a slight decrease in the second quarter from the first quarter of the year.
Key Findings
The National Hospital Flash Report draws on Syntellis data from more than 900 hospitals. Other key findings from the report include:
Hospital Volumes Level Out, but Revenues Tick Up
– Patient length of stay dropped 2.1%, patient days dropped 2.6%, and emergency department visits dropped 2.6% in June compared to May 2022, though all three figures are up when compared to June 2021. Operating room minutes were up 2.4% compared to May 2022. Despite the mixed volume numbers, hospital revenues were up in June. Gross operating revenue was up 1.2% from May 2022.
Physician Practice Volumes Lead to Higher Revenues in Q2
– Net patient revenue per provider full-time employee (FTE) rose 5.6% from Q1 2022 to $388,856 in Q2, up significantly from Q2 2020 (38%), but just slightly from Q2 2021 (1%). Increased provider productivity, particularly in primary care and surgical specialties, led to a 3.1% increase in net patient revenue per provider Work Relative Value Unit (wRVU) from Q1 to Q2 2022.
Historically High Expenses Vex Provider Organizations
– Total expenses for hospitals dropped slightly in June, down 1.3% from May due to a slight decrease in patient acuity, but are up 7.5% from June 2021 and are up 9.5% year-to-date.
– Similarly, while provider compensation dropped in physician practices, expenses continued to escalate with increased patient demand, inflation, and a competitive labor market for support staff leading to a new high for total direct expense per provider FTE in Q2 2022 of $619,682—up 7% from Q2 2021 and 12% from Q2 2020.
Expenses cooled from May’s levels, but inflation has kept them generally high.
– Patients were less sick than last month, requiring fewer expensive drugs — but some supply and drug costs are up.
Contract labor costs are down from May as demand wanes.
– Labor efficiency is improving, although rising employee pay and additional labor pressures are keeping overall expenses high.