
If you are leading efforts to improve and understand public health in your community, we’ve researched and validated that PCCI’s Community Vulnerability Compass (CVC) offers an improvement in advanced insights and performance compared to existing tools that measure community socioeconomic conditions in our neighborhoods. Although getting here took a lot of innovation and perseverance, through a recent publication, we are now able to share what factors differentiate the CVC and why it offers the gold-standard of social determinants of health (SDOH) measurement.
In research published in JAMIA Open, through Oxford University Press’ platform, we detailed how the CVC can help lead the way in measuring community SDOH, while also offering deeper, hyper-localized insights unavailable anywhere else.
Access the full research paper at: https://doi.org/10.1093/jamiaopen/ooaf059
CVC provides a unique methodology embedded into an interactive dashboard that helps stakeholders—including community-based organizations (CBOs), safety-net hospitals, health systems, philanthropic organizations, governmental agencies, universities, and Managed Care Organizations (MCOs)—to make data-driven decisions that enhance health outcomes and drive equity in service delivery.
The CVC’s unique value proposition offers one-of-a-kind insights where it analyzes, at the ZIP Code, census tract, and block-group level, where a community’s most vulnerable residents live and the root cause factors limiting these residents’ ability to thrive. The CVC analyzes 26 clinical and socio-economic indicators that reveal the health, resiliency, and economic vibrancy of neighborhoods. CVC’s analyses provide true, holistic pictures of who needs the most assistance and where to find them, enabling proactive support of those in need.
Though the CVC offers an impressive set of features, as public health leaders, we have choices. There are many available tools we can use to better understand our communities and their social conditions. That is where CVC sets itself apart. It offers localized data to our partners or customers catchment area, not just generalized, large geographical regions. It shows— to the block group — what the social conditions are andthe root causes of those conditions.
For example, our research reflected the differences between CVC and the Area Deprivation Index [ADI], Social Vulnerability Index [SVI], and Environmental Justice Index [EJI]). As presented in the article, the CVC’s Community Vulnerability Index (CVI), and 4 subindexes, were used to classify all 18,638 Texas census-block groups as Very-High, High, Moderate, Low, and Very-Low social vulnerability. Individual patients were then assigned the vulnerability classification of their home address census-block group, creating a bridge between neighborhood-level data and individual-level health insights. CVC’s classifications were compared against three existing community vulnerability tools and validated against individual-level SDOH screening tools or Z-code documentation, but where we clearly separate ourselves from the others is we localize data to our partners or customers catchment area. Spearman rank correlation was used for neighborhood-level comparisons and precision/recall, for individual-level comparisons.
Let’s look at what each of these different systems offer and how we differ in features and performance.
Area Deprivation Index (ADI)
What the ADI Provides: The ADI is a composite measure that uses U.S. Census data to assess socioeconomic disadvantage at a neighborhood level. It provides valuable insights for healthcare providers and policymakers to understand and address health disparities.
CVC Difference: While ADI focuses on socioeconomic disadvantage, CVC goes beyond this by integrating various medical and non-medical determinants of health (NMDoH) indicators to provide actionable insights at the block-group level. CVC provides key insights to strengthen local interventions, empowering both health systems and CBOs to implement strategies directly targeting specific vulnerabilities in their communities.
The Social Vulnerability Index (SVI)
What The SVI Provides: Developed by the CDC, the SVI measures community resilience to external stresses using various social factors. It is commonly used for disaster preparedness and resource allocation.
CVC Difference: While SVI provides valuable data at a census tract level, CVC offers block-group-level insights, allowing for more precise targeting of interventions. CVC focuses on actionable data for public health departments, health systems, and CBOs, empowering them to engage effectively with vulnerable populations.
Environmental Justice Index (EJI)
What The EJI Provides: The EJI assesses the environmental and health burdens faced by disadvantaged communities. It focuses on exposure to environmental hazards, considering factors like pollution and access to green spaces, to identify areas at risk.
CVC Difference: CVC complements the EJI by not only focusing on environmental factors but also incorporating social vulnerabilities that contribute to overall health disparities. This broader perspective allows CVC to provide a more comprehensive understanding of community needs, facilitating targeted interventions that address factors: health, environment, and NMDoH.
In the research presented in the JAMIA paper, we see that overall, the CVC was comparable to, or outperformed, existing neighborhood indexes in measuring key SDOH at both the neighborhood and individual level. CVC showed a strong correlation with existing SDOH indexes from the ADI, SVI, and EJI across multiple social risk domains, demonstrating its ability to identify a cross-cutting range of social vulnerabilities and community equity markers. Additionally, CVC had very good recall rates for individual-level SDOH, both when validated against Z-code documentation and against self-reported survey tools (>75%).
This table, developed for the JAMIA paper, tells the full comparison article1:
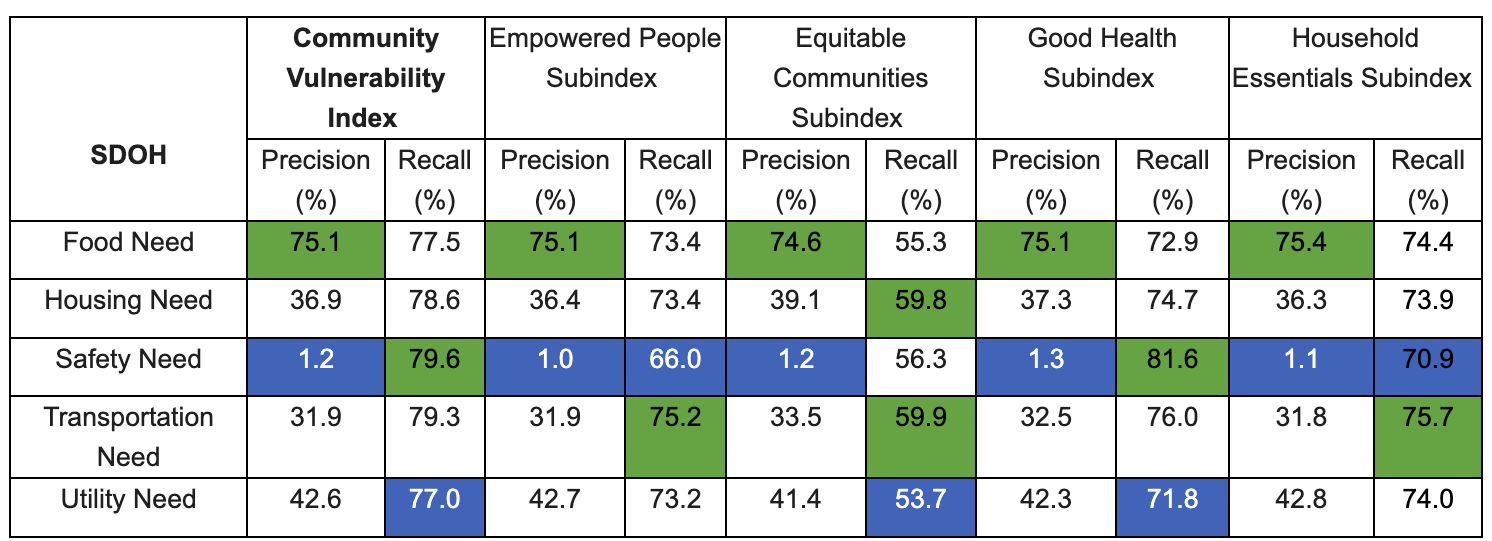
For each CVC Index/Subindex, the highest values of precision/recall are highlighted in green and the lowest in blue; CVC: Community Vulnerability Compass.
PCCI’s CVC has been incorporated into a variety of use cases and settings throughout Texas, including adoption by the Dallas County Department of Health & Human Services, the University Heath (San Antonio) Transplant Center and serves as the backbone for the United Way of Metropolitan Dallas’ Data Capacity Building Initiative, which is helping hundreds of organizations in North Texas turn insights into impact.
As a member of the public health community, I am excited to see how we can use the CVC to better understand the true health of our communities and the contributing root causes. The research we presented in the JAMIA paper is so important to me as it shows clearly how the CVC can give me insights unavailable through any other means.
The thought-provoking results we are seeing gives our public health leaders a trusted new technology that will enable the delivery of more precise approaches to address the needs of those most at-risk in our communities.
About Yolande Pengetnze
Yolande Pengetnze, MD, MS, FAAP, is PCCI’s Senior Vice President of Clinical Leadership where she leads multiple projects including population health quality improvement projects focusing on preterm birth prevention and pediatric asthma at the individual and the population level. Dr. Pengetnze received her MD from the University of Yaounde in Cameroon and completed a Pediatric Residency at Maimonides Medical Center in New York. She was a faculty member at UTSW’s General Pediatric Hospitalist Division where she completed a General Pediatric/Health Services Research Fellowship training and earned a Master of Sciences in Clinical Sciences.