What You Should Know:
– U.S. healthcare organizations continued to face mounting expense pressures at the end of the third quarter of 2025, resulting in persistently thin operating margins despite steady growth in gross revenue.
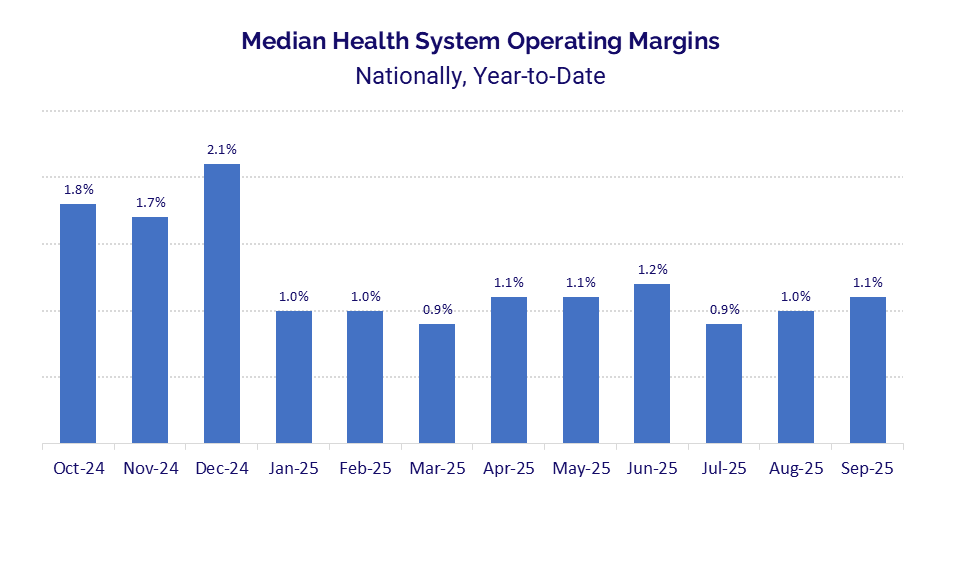
– According to the latest data from Strata Decision Technology, the national median year-to-date (YTD) operating margin inched up slightly to 1.1% in September, remaining consistent with the strained levels seen throughout the year.
Pressure of Non-Labor Expenses
The primary drag on hospital financial performance came from rapidly escalating non-labor expenses, particularly in supplies and pharmaceuticals.
- Drug and Supply Inflation: Drug expenses saw a double-digit year-over-year (YOY) jump of 12.8%, while supply expenses climbed 12.1% YOY (September 2024 to September 2025).
- Total Expense Growth: These increases pushed total non-labor expense up 9.3% YOY, significantly outpacing the 5.0% increase in total labor expense. Overall, total hospital expenses rose 7.5% YOY to close the third quarter.
- Regional Disparity: Financial pressures were uneven across the country. Hospitals in the Midwest experienced the steepest YOY increase in drug expenses (17.3%), followed closely by the West at 15.7%.
“Operating margins have faltered throughout the first three quarters of 2025 as healthcare organizations feel the full weight of rising expenses,” said Steve Wasson, Chief Data and Intelligence Officer at Strata Decision Technology. He added that organizations must be disciplined in aggressively managing expenses to sustain performance amidst economic forces and tariffs.
Outpatient Boom Drives Revenue
While expenses grew, patient demand shifted further toward outpatient care, driving notable increases in gross revenue.
- Outpatient Volume Surge: Outpatient visits rose 9.8% YOY nationally in September, with the South and Midwest leading the country.
- Inpatient and Emergency Shifts: Inpatient admissions saw a 5.3% YOY increase, and observation visits rose 1.5%, while emergency visits declined slightly by 0.5%.
- Revenue Mirror: Gross operating revenue mirrored these utilization patterns, increasing 11.4% YOY, driven by a 12.8% increase in outpatient revenue and a 9.8% rise in inpatient revenue.
Relief for Physician Practices
Physician practices saw the first signs of financial relief in 2025.
- Decreased Investment: The median investment required to support practice operations decreased YOY for the first time in 2025. The median investment per physician full-time equivalent (FTE) was $311,264 in the third quarter, down 4.7% from the prior quarter and 1.8% from Q3 2024.
- Stable Expenses: Median total expense per physician FTE remained high at around $1.1 million (up 3.9% YOY), but did decrease by 1.3% compared to Q2 2025.
The report utilizes data from Strata’s StrataSphere® database and Comparative Analytics, drawing from over 650 hospitals and 135,000 physicians, representing approximately 25% of all provider spend in U.S. healthcare.